
How to use sell-through rate before you mark down
Sell-through rate tells you what is slow, not why. How to read it before Black Friday, and what to change on the page before you reach for a discount.
By Lassi Eronen

By early November every brand has a list. The coat that was meant to be gone by now. The color nobody expected to sit. This year the list may be longer. Online clothing retailers in Britain told the Office for National Statistics that their autumn and winter ranges did not perform well in September because of the warm weather.
The pressure to discount is arriving earlier too. H&M expects its markdown costs to rise somewhat this quarter, partly because the November campaign period leading up to Black Friday has become longer and more extensive. Adobe forecasts that in the US the best apparel deals, at 23%, land on Black Friday itself. So someone will soon ask you to put a discount on the whole list.
Most of those lists start with sell-through rate, and that is the right place to start. It tells you what is slow. It doesn't tell you why, and the why decides whether a product needs a discount at all.
How to calculate sell-through rate
Sell-through rate is the share of your stock that has sold. Divide the units sold by the units you had available to sell, then multiply by 100. If you received 500 units of a coat and sold 175, its sell-through rate is 35%.
The detail that changes the answer is the clock. Measure from the day a style arrived and you see the season. Measure the last 30 days and you see the current pace. Shopify's Products by sell-through rate report opens on the second view, dividing units sold in the period by those units plus what is left at the end. A style that arrived with 100 units, sold 30 early on and 20 in the last 30 days has sold 50% of its stock, and the report shows 29%. Neither is wrong. Just don't compare one with the other.
Three more things to know about that report. It works per variant, so it can see individual sizes. It doesn't count returns. And since October 1 it measures on-hand stock rather than available stock, so figures from October on aren't like for like with September's.
You will also find plenty of numbers for what counts as good. Shopify's own guide says 70% to 80% for in-season stock without giving a source, and software vendors range from 30% to 85%. None we've seen says how it was measured. The comparison that holds up is your own, a product against the rest of its collection at the same number of weeks after arrival.
A slow product can be slow for three reasons
Rule out the obvious first. A style that landed last week hasn't had time to be slow. After that, low sell-through has three common causes, and they need different answers.
Shoppers didn't see it. Collection pages are long. In 2020 Baymard counted 72 products on an ASOS list taking up 18 screens on a phone. Sort order decides who gets the early screens, and sales-based sorts favor what has already sold. Shopify defines its Best selling sort by the all-time number of orders that include a product, so a style that landed in September competes against years of orders. It needs orders to rank and rank to get orders. One e-commerce lead asked us how to avoid exactly this self-fulfilling loop.
A randomized test on hotel listings found that ranking changed which hotels people looked at, and that once they had looked, it didn't change whether they booked. A collection page isn't a hotel list, but the logic is the same. In the report, a product nobody scrolled to looks just like a product nobody wanted.
Shoppers wanted it, but their size was gone. A style that has sold through its mediums and larges stalls on the sizes nobody came for. Demand was strong and the number looks weak. Zara treats this as a display problem. A study of its stores describes articles coming off display when a key size runs out.
Shoppers saw it and passed. Plenty of looks, few clicks, few adds to cart. That is the product, the price or the picture. Moving it up spends your best page space on something shoppers have already answered.
High numbers mislead too. 75% of a 40-unit buy is 30 sales, and 20% of a 1,000-unit buy is 200. A style that keeps coming back can still look like a winner, since returns don't touch the report or the Best selling sort. And a fast seller down to two sizes shouldn't lead the page at all, because the top spot sends most shoppers to a product they can't buy.
What to do with each product before Black Friday
Start this week and you have time for one round, so begin with your biggest collection and stop when the week runs out. For each product, pull its sell-through since it arrived, by setting the report's start date back before it landed, plus its weeks on site and its units left by size. Call it slow if it trails the rest of the collection at the same number of weeks after arrival.
Then work out how much of a chance it had. As far as we can find, Shopify's reports don't show how many shoppers saw a product in a collection grid, and you probably have no record of where it sat last month, so estimate. Open the collection on your phone and note how far down the product is today, then correct for anything you remember moving. If you have product page views from your analytics, read them alongside that. Low on the page with few views means hardly seen. High on the page with few views means seen and passed.
Each product now falls into one of four groups. Treat that as your first draft of the page, not its final order. The piece you built the season's story around can stay where you put it, whatever its numbers say.
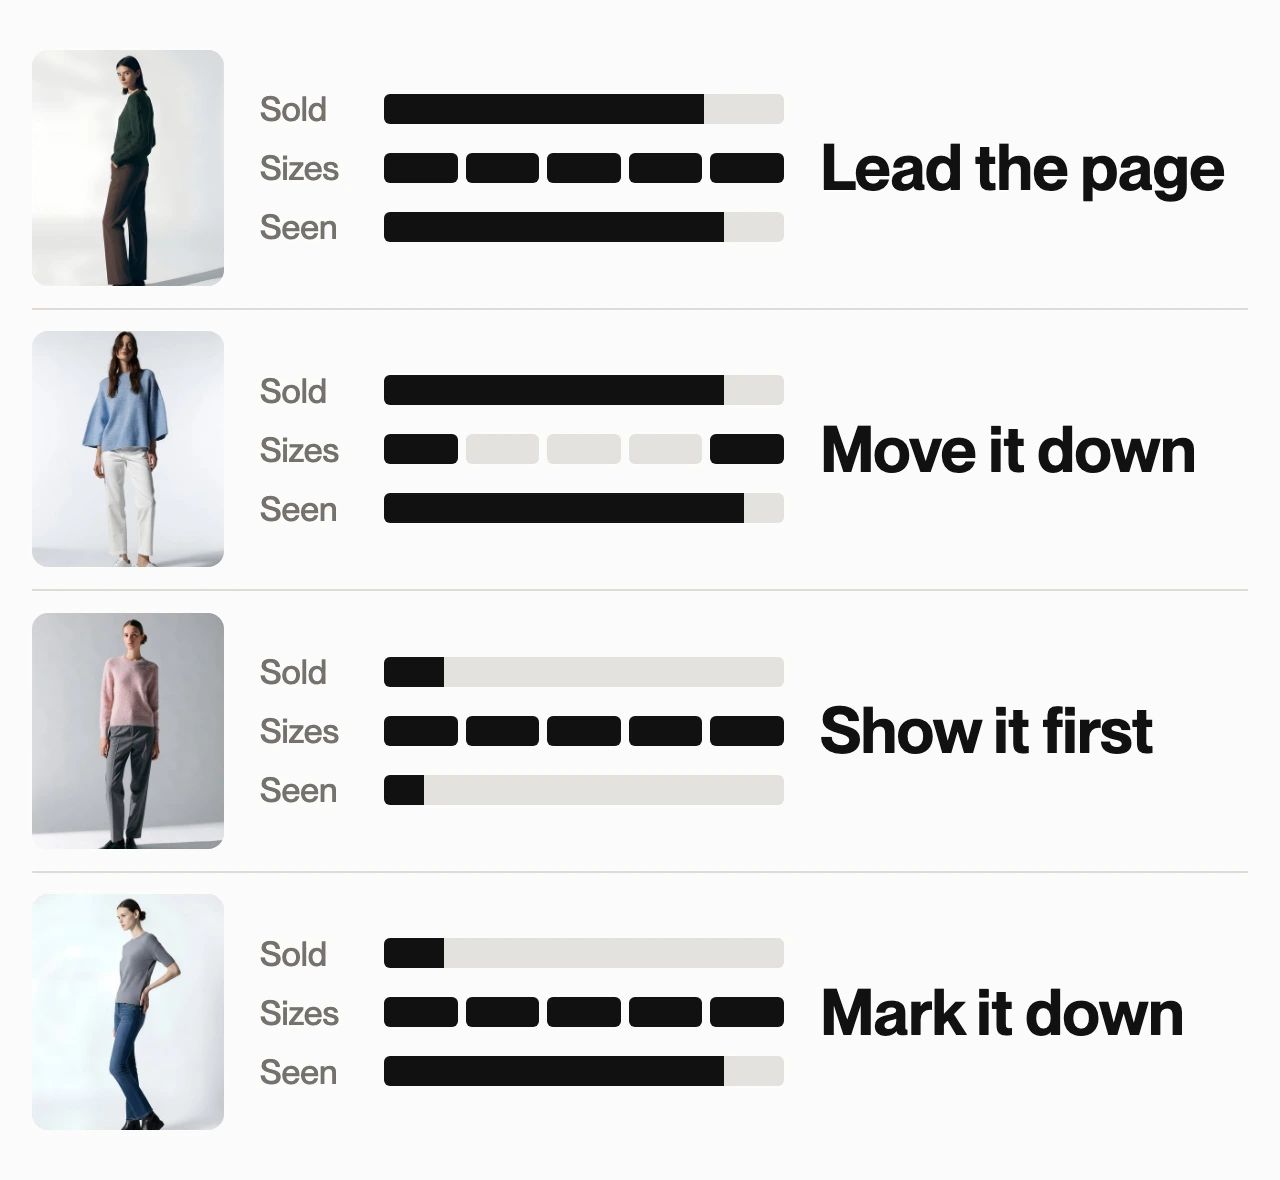
Sold and sizes come from your reports. Seen is your estimate.
- Selling, with sizes in stock. Let it lead the page, in whatever order still looks like your brand. This is what you want shoppers to land on when the traffic arrives.
- Selling, but sizes are going. Move it down before it sells out. It has found its buyers, and a top spot on a product in two sizes mostly sends shoppers to a size they can't buy. A sports equipment brand we work with does this ahead of time. It reads the last three weeks of sell-through and buries what is going to run out regardless. Shopify's Products by days of inventory remaining report finds these quickly. A slow style with broken sizes gets the same treatment.
- Slow, and hardly seen. Show it first. Pin a few of these into the top rows now, between your leaders and not above them, and leave them for a week. Keep it to a handful per collection and choose them by eye, because the page still has to look like your brand. Don't compare units sold before and after, because traffic and promotions are climbing for everything this month. Compare it with the products next to it that same week, which got the same traffic and the same offers. If it holds its own, it has earned the spot and you kept the margin. If it doesn't, it moves to the next group, and now you know. On a smaller store a week of numbers is a rough read, so treat it as a nudge and not a verdict.
- Slow, and seen plenty. Look at the picture first, because if you have a better image, trying it costs no margin. If the picture is right, mark it down, and soon. A study of a fashion retailer found the highest profits came from small markdowns early in the season, and that shoppers who expect markdowns wait for them. Holding full price until Black Friday week and then cutting deep is what that study argues against. Decide at the same time whether the product also takes your Black Friday offer. If you sell in the EU, the "was" price you show has to be your lowest price of the previous 30 days, so a cut this close changes what you can show that week. Countries can make exceptions for reductions that deepen step by step, so check yours. In your sale collection, put what you most need to clear at the top by hand, because a best-selling sort leads with what is already moving.
Nobody has tested this order on fashion pages, as far as we can find. We'd do it anyway. A discount answers a demand problem, and a product nobody saw hasn't shown you a demand problem yet. The costs differ too. A week in the top rows costs whatever your leaders would have sold from those slots, and you can undo it at any time. A discount is much harder to take back. Say a coat sells at a 60% gross margin. A 25% discount takes more than 40% of the profit on every coat.
None of this rescues a bad buy. Some products will sit wherever you put them. If you also need the calendar for the changeovers themselves, our seasonal merchandising guide has a four-week plan.
When slow turns into dead stock
Dead stock is stock you bought and can't sell. There is no agreed cutoff, and software vendors say anything from 90 days to a year. For fashion, a full season without a sale is a sensible line.
Once the peak is over, read what's left. Take it off your main collections so it stops pushing down products that can still sell. Then choose an exit, whether that is an outlet collection, a gift with purchase, a sample sale or a liquidator. And take the numbers to your next buy, which is where dead stock is really decided.
Seeing it while you arrange the page
We build merchandising software, so we aren't neutral on this part. In Depict, clicks, orders, sell-through and revenue can sit on every product card while you arrange the collection, so these decisions happen on the page and not in a report in another tab.
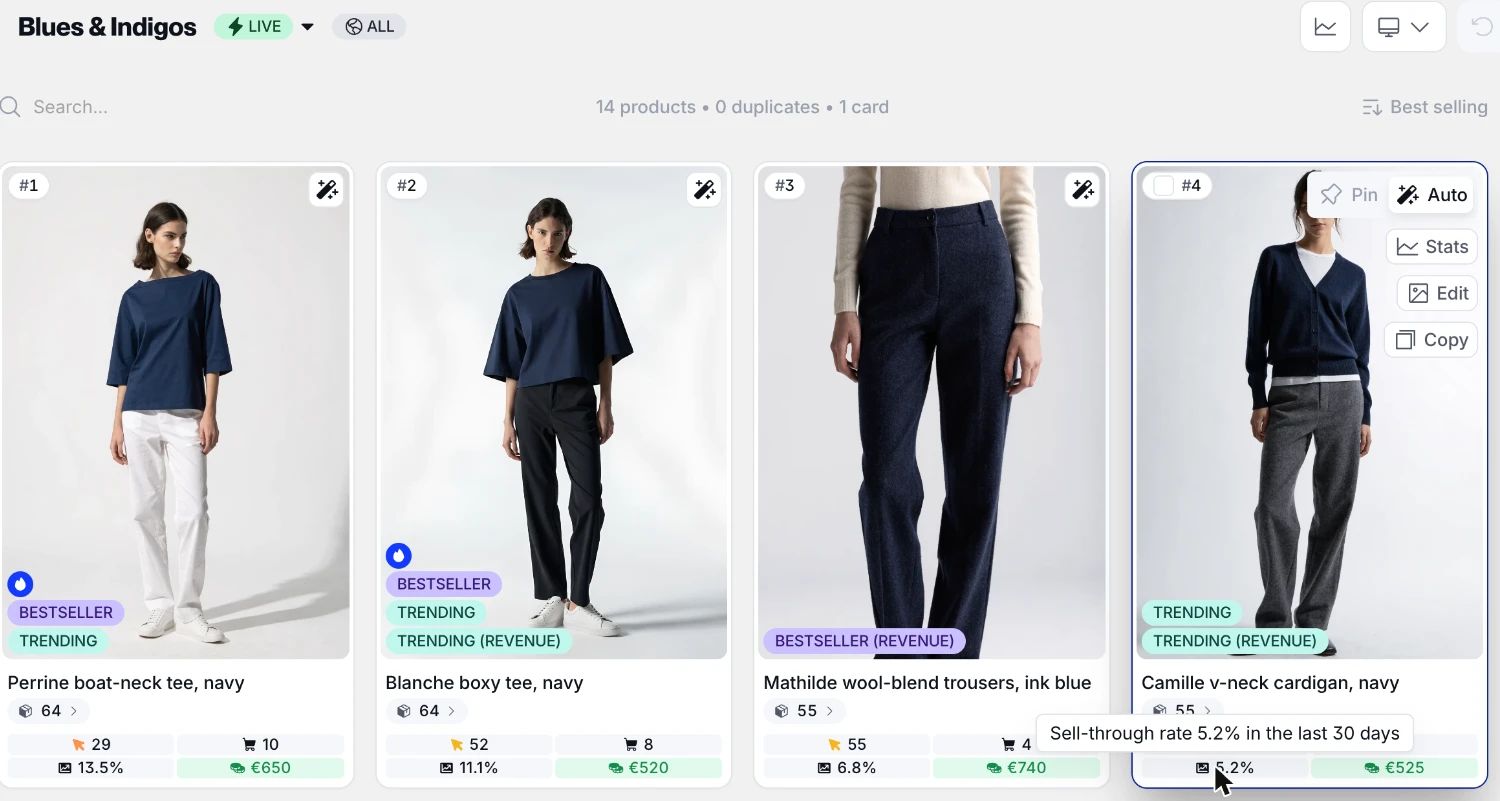
A collection in Depict on our demo store, with sample numbers. The cardigan on the right has the most clicks in the row and the lowest sell-through.
Open a collection's performance view and you see each product's position and its average position over the period, how many shoppers saw it in the grid, and how many clicked. That is how you tell "nobody saw it" from "they saw it and passed".
A pinned product stays where you put it and the automatic sort fills in around it, so your hand stays on what defines the page. Sold-out products drop to the bottom of every collection on their own, and products with only a few sizes left can be pushed down too, so your time goes to the decisions a rule can't make. Book a demo and we'll show you on your own collections, before the peak or after it.