
Collection page analytics that actually matter
Discover the e-commerce collection page metrics that actually impact growth- beyond vanity pageviews. Learn what to track, how to measure, and where to optimize your merchandising to drive better synergy across your sales funnel.
By Kiera Richmond
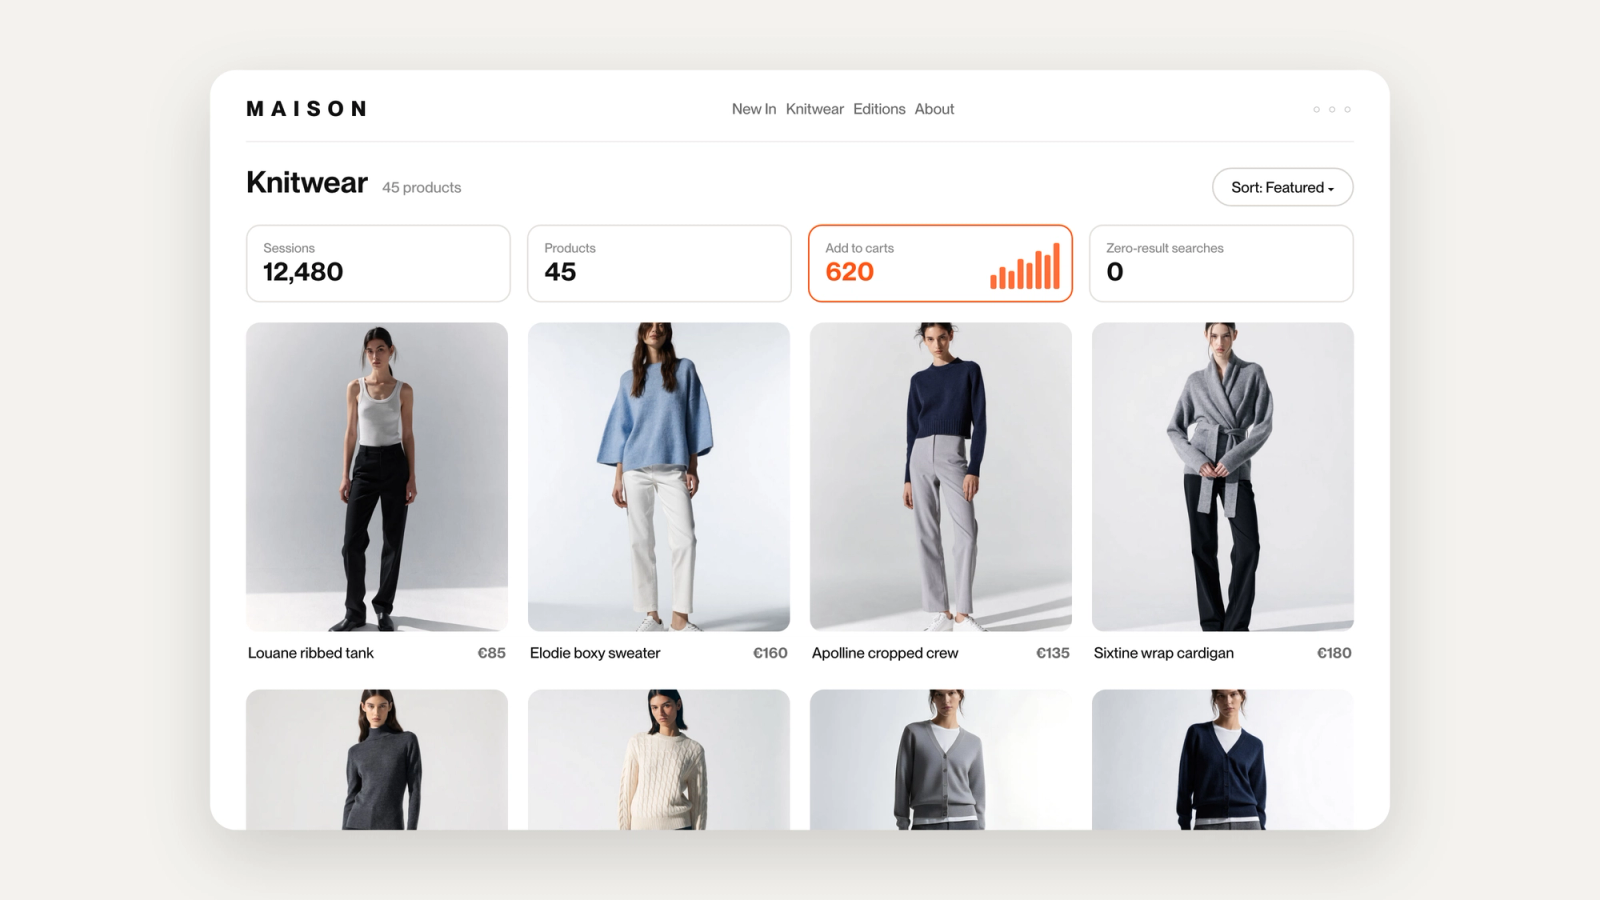
Collection pages, or category pages, are the digital aisles of your e-commerce flagship. They play a key role in product discovery and sales; in fact, up to 70% of online purchasing decisions are catalysed by collection pages. Despite this, many e-commerce teams still over-dedicate their attention to surface-level metrics such as raw page views. We take a look past basic view counts, dialling in on the collection page KPIs directly impacting revenue growth. You’ll learn which metrics correlate with purchases, how to measure effectiveness of product discovery, realistic benchmarks for high performance, and analytics workflows to integrate data into merchandising strategy.
Revenue-Predicting Collection Metrics
Judging collection page performance purely by traffic is ineffective. High page views might be great on a slide deck, but they don’t guarantee that shoppers are finding what they want or, more importantly, that they are converting. A shopper accidentally landing on a collection page still counts as a page view, yet adds no revenue. Replace these metrics with actionable KPIs that will track intent, progression through the sales funnel, and overall order value.
Collection-Level Conversion Rate:
The percentage of shoppers completing a purchase from a specific collection page visit. This answers a fundamental question: out of everyone who browsed this collection, what proportion actually purchased from it? If a collection page with high traffic struggles with a low conversion rate, this signals issues with sorting logic, out-of-stock visibility, product range, or pricing.
Click-Through (CTR) to Product Pages (Product Discovery Rate):
The percentage of collection page visitors who click through to at least one PDP (Product Detail Page). The primary role of the collection page is to guide shoppers from broad browsing through to specific items, ultimately to purchase. If they are not clicking products, they are significantly less likely to buy. Low CTR suggests weaknesses in default sorting, visual merchandising and product hierarchy, whilst high CTR confirms that the collection pages are inspiring intent.
Bounce and Exit Rates:
Bounce rate tracks visitors landing on collection pages who leave without taking any action. Exit rate tracks visitors who leave your site from one specific page, even when they have browsed other pages first. High exit and bounce rates show dead ends in site navigation; if 50% of visitors exit from one page, it likely feels improperly sorted, irrelevant, or lacking intuitive product discovery.
Revenue per Visitor (RPV) & Add-to-Cart Rate:
RPV measures the combined value of conversion rate and Average Order Value (AOV) as a single monetary metric per session. Tracking RPV per collection shows which categories yield the highest monetary return per visit. Add-to-Cart rate measures the percentage of visitors to a collection who add an item to their cart, serving as a strong indicator of purchase intent.
Measuring Product Discovery Effectiveness
Product discovery should be frictionless, matching shoppers quickly to products they love. Here is how to assess whether your collection pages are delivering on this.
PDP Progression Rate:
Industry data shows approximately 50% of healthy e-commerce sessions lead to a product page view. If your collection page rates fall significantly short of this standard, shoppers are abandoning your catalogue without looking further.
On-Site Search and Use of Filters:
Shoppers head for the search bar when collection pages fail to immediately surface relevant items. Customers who use internal search convert two to three times higher than general browsers, driven by their significantly higher purchase intent. If a large proportion of users immediately search upon landing on a collection page, or if search exit rates surge, your category hierarchy or default sorting is failing to surface what they need.
Merchandising Feature Engagement:
Pair GA4 event data with qualitative heatmapping tools to assess on-page behaviour. Tracking filter selections reveals how shoppers narrow down purchasing options, whilst scroll maps show how far users explore your product lists. If heatmaps indicate that four in five shoppers never scroll past the top two rows of products, those primary positions dictate almost all category performance.
Benchmarks: Defining ‘Good’
Performance can vary by sub-category, so setting clear benchmarks helps with understanding underperforming collection pages.
Bounce Rates:
Aim to maintain a bounce rate between 25% and 40% for collection pages acting as landing pages from ads or searches. Anything above 50% suggests a mismatch with customer intent or slow loading times.
Relative Category Performance:
Compare specific collections against your site-wide averages. If your New In page converts at 5%, whilst your denim drops to 1.5%, check for assortment depth, visual presentation and inventory availability to drive consistent performance.
Collection Engagement’s Impact on Conversion Rates
Optimising category pages has a direct and measurable impact on revenue. Improved collection page User Experience (UX) and smarter digital merchandising boost conversion rate by up to 30% and reduce bounce rate. Micro-UX tweaks can also move the needle; adding interactive swatches on collection grids and sticky filter menus can remove friction when browsing more specific product categories.
A Lean Analytics Stack for Merchandising
You can make data-backed merchandising decisions today by using a clear and effective analytics framework:
Optimise with Google Analytics 4 (GA4) Funnels and Reports:
Configure custom funnels for exploration inside GA4 to track the shopper journey from viewing collections to completing a purchase. You can segment funnels by device type and source to decipher exact drop-off points.
Use Native Reports and Apps:
Leverage your ecommerce platform’s reports like Sales by Product Collection and Sessions by Landing Page to track revenue by collection, and export data into tools like Looker Studio for easy monitoring of RPV and CTR.
Heat Maps and Session Recordings:
Use tools like Hotjar or Microsoft Clarity on key collection pages to see visuals of clicks, scroll depth and friction points on the path to purchase.
A/B Testing:
Test collection page merchandising variations, such as content card positioning, imagery, or altering default sorting orders, benchmark this against control collections, and measure direct impact on conversion.
AI and Personalisation:
AI product discovery platforms like Depict automate high-converting merchandising rules in real-time, dynamically sorting collection grids based on visual appeal, impact on demand, shopper intent, and stock levels. This drives considerable uplift in collection-level conversion and RPV.
Summary Checklist
Transform your ecommerce store into a high-converting digital flagship by adopting this optimisation loop.
- Audit the effectiveness of vanity metrics, and shift focus from pageviews to Collection Conversion Rate, PDP CTR, and RPV.
- Ease friction by ensuring filter controls and interactive swatches make product exploration effortless.
- Optimise by placing high-converting, fully-stocked, and visually appealing products within the top two rows of collection pages.
- Track the discovery funnel, continuously monitor progression rates between collection views and PDPs in tools like GA4.
- Leverage automation by implementing AI-powered sorting to balance revenue optimisation with aesthetic visuals.